The Assurance Report is only as credible as the methodology behind it. This page explains how ProjectPhD produces its findings — the evidence base, the benchmarking model, the corroboration mechanism, and the confidence interval/weighting when there’s not enough data.
The evidence base
The diagnostic methodology and dataset were first structured in 2013 by Mozaic Management Consultants, informed by academic project research literature in collaboration with the John Grill Institute for Project Leadership. The research question was practical: what observable controls and conditions at a stage-gate decision correlate with whether a program achieves its intended outcomes?
Over two decades, the team has conducted more than 2,000 diagnostics across ERP implementations, regulatory change, infrastructure, and digital transformation. Twelve hundred of those engagements have been coded to actual delivery outcomes — what the sponsor expected, and what the program actually delivered. The dataset is not a sample of convenience. It reflects programs of varying size, sector, technology, and complexity, with outcomes tracked through to completion, and it’s always growing.
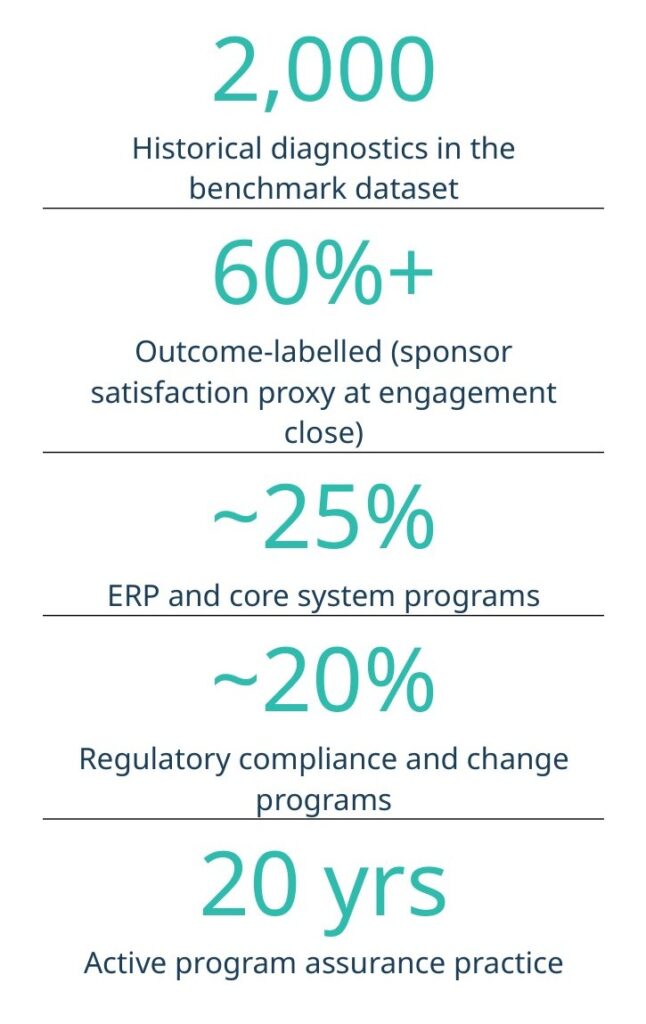
“Outcome-coded” means the result is known. For each engagement in the coded dataset, the diagnostic responses are paired with a recorded outcome: did the sponsor judge the program as having delivered to expectations, and did the intended business outcomes materialise? This outcome data is what makes the benchmark empirical rather than normative. The comparison is not “how you score against a maturity model” — it is “how programs with similar control profiles actually performed.”
How benchmarking works
When a program completes the diagnostic, its responses are matched to a peer cohort drawn from the dataset. Matching is by sector, program type, size, delivery stage, technology, and complexity. The benchmark shows how comparable programs performed — not a generic average across all programs.
Statistical regression identifies which control dimensions correlate most strongly with outcomes in the matched cohort. This is what drives the prioritisation in the 90-day action plan: the interventions are ranked by what historically made the most difference in programs like this one, not by what seems most urgent to the delivery team.
When the matched cohort is small, the report says so. Confidence intervals are widened, and the basis of comparison is disclosed explicitly. A thin cohort does not invalidate the assessment — but the report is transparent about the confidence it can and cannot carry.
The diagnostic methodology is versioned and dated. Every Assurance Report and Governance Decision Memo records the methodology version in use. Changes to the methodology are documented and version-stamped.
Four controls govern the benchmark dataset.
| Peer Review The methodology is reviewed by independent practitioners on a scheduled basis. The review version is dated and published. The version number appears in every Board Assurance Report and Governance Decision Memo. “Methodology v1.2, reviewed [month/year]. Buyers can verify the version against the published schedule.” Recorded in every Board Assurance Report and Governance Decision Memo. | Recency Dating Every benchmark cohort displays the date range of contributing diagnostics. Cohorts older than a defined threshold are flagged explicitly. “Dated cohort — interpret with care.” No silent use of stale cohort data. If the cohort is dated, the Board Assurance Report says so. |
| N-Disclosure When cohort matching produces a thin result set, the Board Assurance Report states that directly. “We matched your program to a cohort of eight. Interpret the percentile with caution.” Confidence intervals are widened where N is low. False precision is worse than disclosed uncertainty. | Outcome Labelling Basis Outcome labels are based on two sponsor-reported statements at engagement close: “Did this program deliver to your expectations?” and “Did it achieve the business outcomes you expected?” This is a consistent proxy across the dataset — not objective success measurement. The basis and its limitations are disclosed in every Board Assurance Report. |
The Alignment Index
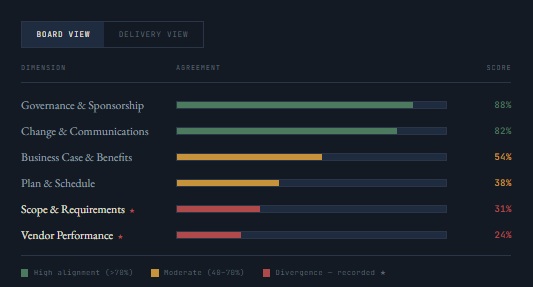
The diagnostic collects structured inputs from multiple stakeholders independently. Each respondent completes the assessment without visibility into others’ responses. Each attests that their inputs reflect the program’s current reality.
This multi-respondent model addresses a fundamental weakness in single-source reporting. When one person describes the program’s health, the description reflects their position, incentives, and proximity to specific risks. When multiple stakeholders provide independent assessments across the same dimensions, divergence becomes visible.
The Alignment Index measures that divergence. Where the Program Director flags resourcing as a critical concern but the Sponsor rates it green, that disagreement is documented as a governance signal — attributed to role, not to named individual. The governance forum must resolve the divergence; it cannot ignore it.
This is the mechanism that pierces filtered reporting. The Alignment Index does not assign blame. It surfaces the disagreements that internally-generated status reports conceal — and presents them as evidence the governance forum can act on.
The Recommendations Library
The ProjectPhD Recommendations Library is a proprietary collection of conditions-to-proceed and interventions built across 20 years of program assurance engagements by a team of practitioners, informed by research into delivery outcomes. Each recommendation is grounded in what correlated with better outcomes in comparable programs — not in generic frameworks or single engagement anecdotes.
Conditions-to-proceed drawn from this library are tailored to the program’s specific risk profile and included in every Assurance Report. ProjectPhD recommends the conditions; the governance forum — Sponsor, board, steering committee — adopts and enforces them as commitments attached to stage gate decisions.
Document upload and review
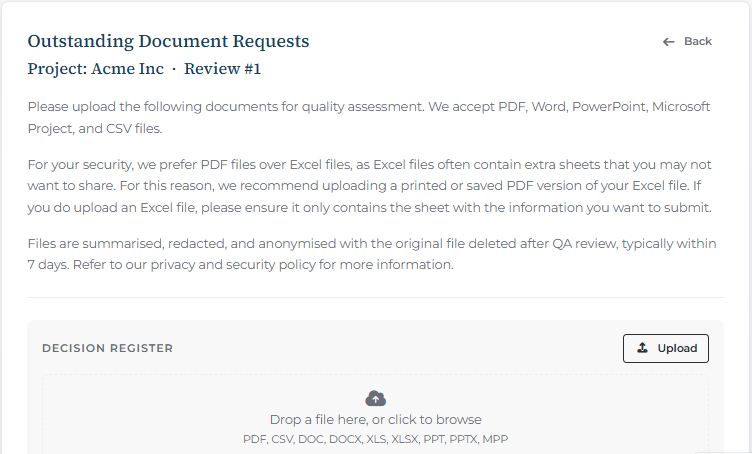
Document uploads are optional based on your requirements and security posture, but provide further evidence for the assurance review. The documents are reviewed first by AI and then by our experienced delivery experts, against a standard assessment matrix, and this assessment is fed into the tool alongside the questionnaire answers.

The report
The report is generated from the tool, and then reviewed and refined by our team of delivery and PMO experts. The software tool saves a significant amount of time and provides an objective, statistical analysis of project success and risk factors, but no significant analysis or recommendation should be left to a computer. We are not a pure AI tool, and we do not hallucinate in our reports. Every Assurance Review is checked by a human, who adds the benefits of their experience to the benefits of the tool. The output thus achieves the best of both worlds, and avoids the issues of either, giving most of the speed of an AI based tool without the quality issues, and the rigour of an Assurance Review without the cost or delivery time.
The main difference between Project PhD’s output and a full assurance review is that the tool is questionnaire based, with no in-person interviews. It is designed to be rigorous enough to justify funding decisions, while being deliverable at the speed required for those decisions. If significant risks are uncovered, a full review is recommended, which can be referred to Mozaic Consulting or the tool can produce a full RFP pack to provide to your assurance panel. The tool will not recommend a review unless it is warranted, with justifying reasons explicitly detailed in the report, and the full review recommendation and scope are agnostic with regard to provider – they are not weighted towards Mozaic. For more information, please see our page on Independence & Scope.